Introduction
- Brief Introduction of the Company: Padam Cotton Yarns Limited is a public limited company which started operations in India on November 2, 1994. The company is also listed on the BSE stock exchange. The company’s office is located in Karnal, Haryana. After a long period, the company resumed their operations, focusing on trading in yarns and textile products, as well as financing activities, because they stopped its operations due to a massive fire incident in 2001.
- Industry Overview: The Indian textile and apparel industry is significant at the global as well as at the country level. This industry produces employment and economic growth in the country. This industry has a very great future because of the increasing demand for textiles and fashionable products.
- Purpose of the Analysis: This research and analysis will help to understand the financial condition of PADAM Cotton Yarn Ltd. Also this analysis will help to know more about the company and about the Textile industry. The analysis will cover all companies’ profit and loss statements, balance sheets and key financial ratios.
Company Overview
Background and History
Padam Cotton Yarns Ltd. is part of the textile industry. The company operates in yarn and textile materials, which are used by manufacturers. The company was established in 1994 and their headquarter is located in Haryana. The company faced a huge fire incident at a manufacturing plant in 2001; because of that, they faced a loss of around 11 Cr. but they got around 6 Cr through insurance.
Business model
The company follows the Trading-business model –
- Purchase of yarn and textile material.
- Supply and distribution to manufacturers.
- Recently engaged in lending and investing activities.
Key Products and Services
- Wool Tops
- worsted yarn
- Cotton Yarn
- Synthetic Yarn
Market Positioning
The company is currently positioning itself in the domestic textile trading market. Aiming to gain emerging trends and demand for fashion and textile products. Mainly focus on cost-effective product and supply chain management.
Promoters / Founder
| Name | Designation | Professional background | Role in company |
| Mr. Dinesh Shreevastav | Whole-Time Director & CFO | Finance and Management | Oversight of financial reporting and executive operations. |
| Mr. Mahendra Singh | Non-Executive Director | Law (Jai Narain Vyas University); 15+ years in the Textile Industry | Strategic guidance on retail and wholesale textile markets. |
| Mr. Ashutosh Alaru | Independent Director | Experienced Professional | Governance and independent oversight. |
Financial Analysis
Income Statement Analysis
(In Cr.)
| Particular | FY2025 | FY2024 |
| Income from operation | 14.22 | 0.004 |
| Total Expenses | 12.13 | 1.93 |
| Profit Before Tax | 13.07 | 1.99 |
| Net Profit / Loss | 10.26 | 1.99 |
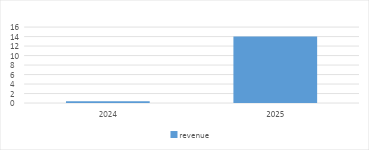
Key Observations of the Income Statement:
- There is a very high increase in revenue in FY25 as compared to FY24 i.e. 14.22 Cr.
- The company generated 10.26 Cr. profit in FY25.
Balance Sheet Analysis
| Particular | FY2025 | FY2024 |
| Equity share capital | 12.91 | 3.87 |
| Total Current Assets | 29.98 | 3.11 |
| Total Current Liability | 13.19 | 0.02 |
| Total ( End of FY) | 30.46 | 7.02 |
(In Cr.)
End of the FY25 –
- Equity share capital: There is a huge change in equity share capital. It jumped directly to 13 Cr. from 3.87 Cr.
- Total Current Assets: FY25 current assets are increased as compared to FY24. i.e. 29.98 Cr.
- Total Current liability: Massive increase in current liability because companies resume their operation in this FY.
Cash Flow Statement
(In Cr.)
| Cash / FY | FY2025 | FY2024 |
| Operating | -3.88 | 4.73 |
| Investing | 3.44 | -3.45 |
| Financing | -0.41 | -0.22 |
| Cash and Cash Equivalent (In the end ) | 0.19 | 1.05 |
Note –
There is negative operating because of high trade receivable.
There is an increase in financing because of loans.
Key financial Ratio
- Profitability Ratio: ROE – Net profit/shareholder equity *100 = 77.62%
- Liquidity Ratio : Current Ratio – current assets / current liabilities = 2.27
- Leverage Ratio: Debt to equity ratio – Total Debt / Shareholder equity = NA (No debt are outstanding)
- Efficiency Ratio: Net Profit Ratio ratio – NPAT / Net Sales = 4.61%
Year-on-year comparison
Key Insights And Interpretation
- Strengths
1) The company has 0 debt outstanding currently.
2) The company has successfully identified an emerging trend in the market and is currently working on it.
3) The management board has good experience.
- Weakness
1) The company was non-operational for the last 2 decades, so they didn’t have past data to analyse.
2) Currently, most of the revenue is from financing and trading activity rather than manufacturing.
- Risk factor
1) High volatility in the global textile market.
2) Pricing pressure because of lots of small companies.
- Future Outlook
The company management is positive about the domestic market and on their plans. They will be focusing on online expansion, different variety expansion etc. The company wanted to focus on making a new brand and will plan according to data analysts.
Conclusion
Final Evaluation Of Financial Condition
The Padam Cotton Yarn Ltd. is in a strong comeback phase as they faced huge problems in the past. They are generating a good amount of revenue from operations in this Financial Year with increased capital. The company is debt-free for this Financial Year.
Investment / Performance Perceptive
The company is in a comeback phase, so the company primarily generated good revenue but from financing and trading activity rather than their primary manufacturing activity. The company is generating huge revenue but investors should monitor for some time because the company didn’t have their past financial data. Also, the company is now operating on new business activity.
Sources