SUMMARY
This analysis examines the export and import performance of Geo Textiles (Geotech) over the past five years, based on data from the Ministry of Commerce & Industry. In FY 2025-26, Geotech exports amounted to INR 633 crores, representing a significant share of the overall Technical Textiles category, which recorded total exports of INR 7046 crores. On the import side, Geotech products accounted for INR 556 crores out of the total INR 6464 crores in Technical Textile imports.
The analysis highlights the top exported and imported Geotech products, along with the major source countries, offering a strategic overview of the industry’s global positioning and trade dynamics. This data provides key insights into trade flows, demand patterns, and emerging growth opportunities within the Geotech segment of the Technical Textiles sector. Examining these trade trends offers valuable perspectives on shifting market demand, evolving global competitiveness, and India’s standing in the international Geo Textiles market.
EXPORT PERFORMANCE
Figure 1: Yearly Trend of Export Performance of Technical Textiles – Last 3 Years
Figure 2: Yearly Trend of Export Performance of Geotech – Last 5 Years

Figure 3: Major Exported Geotech Products
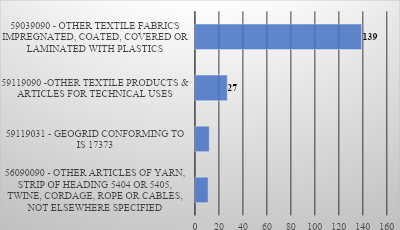
Major Source Countries for Exported Geotech Products
Table 1:
| 59039090 – Other textile fabrics impregnated, coated, covered or laminated with plastics – 139 cr. |
| USA – 125 cr. |
| CANADA – 2 cr. |
| UAE – 1 cr. |
| OTHERS – 11 cr. |
| 59119090 – Other textile products & articles for technical uses – 27 cr. |
| USA – 4 cr. |
| BRAZIL – 3 cr. |
| AUSTRALIA – 2 cr. |
| OTHERS – 18 cr. |
| 59119031 – Geogrid conforming to is 17373 – 12 cr. |
| USA – 8 cr. |
| BRAZIL – 1 cr. |
| SPAIN – 1 cr. |
| OTHERS – 2 cr. |
| 56090090 – Other articles of yarn, strip of heading 5404 or 5405, twine, cordage, rope or cables, not elsewhere specified – 11 cr. |
| USA – 5 cr. |
| AUSTRALIA – 2 cr. |
| FRANCE – 2 cr. |
| OTHERS – 2 cr. |
IMPORT PERFORMANCE
Figure 4: Yearly Trend of Import Performance of Technical Textiles – Last 3 Years

Figure 5: Yearly Trend of Import Performance of Geotech – Last 5 Years
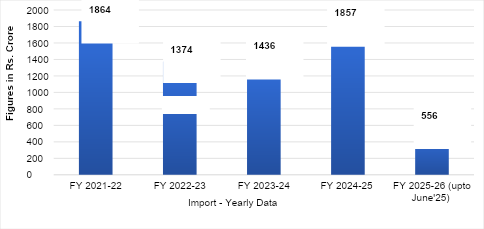
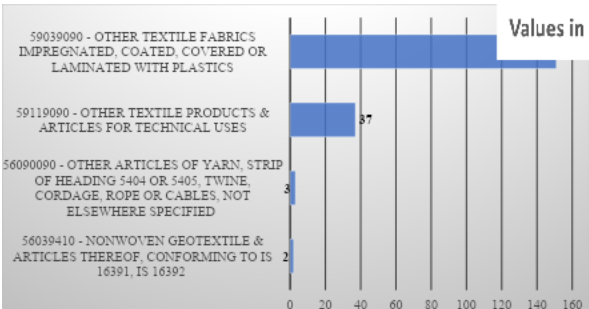
Figure 6: Major Imported Geotech Products
Major Source Countries for Imported Geotech Products
Table 1:
| 59039090 – Other textile fabrics impregnated, coated, covered or laminated with plastics – 151 cr. |
| CHINA P RP – 113 cr. |
| VIETNAM SOC REP – 11 cr. |
| GERMANY – 9 cr. |
| OTHERS – 18 cr. |
| 59119090 – Other textile products & articles for technical uses – 37 cr. |
| CHINA P RP – 14 cr. |
| UK – 4 cr. |
| HONG KONG – 4 cr. |
| OTHERS – 15 cr. |
| 56090090 – Other articles of yarn, strip of heading 5404 or 5405, twine, cordage, rope or cables, not elsewhere specified – 3 cr. |
|---|
| CHINA P RP – 2 cr. |
| NETHERLANDS – 0.22 cr. |
| HONG KONG – 0.19 cr. |
| OTHERS – 1 cr. |
| 56039410 – Nonwoven geotextile and articles thereof, conforming to IS 16391, IS 16392 – 2 cr. |
| VIETNAM SOC REP – 1 cr. |
| CHINA RP – 1 cr. |
| ITALY – 0.44 cr. |
| OTHERS – 0 cr. |